Pictures of nonabelian sandpile growth model

Back to my homepage.


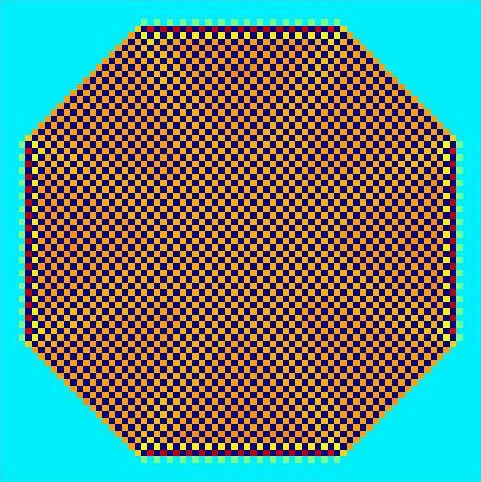
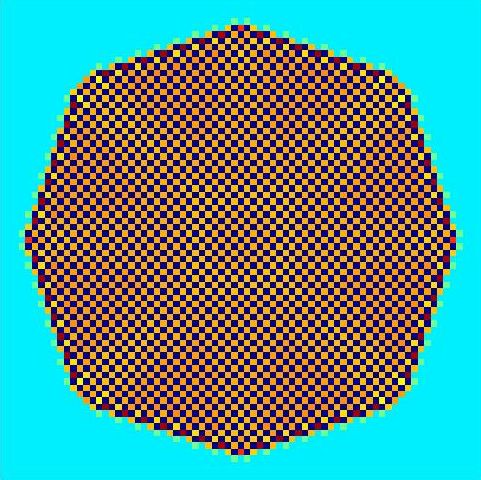
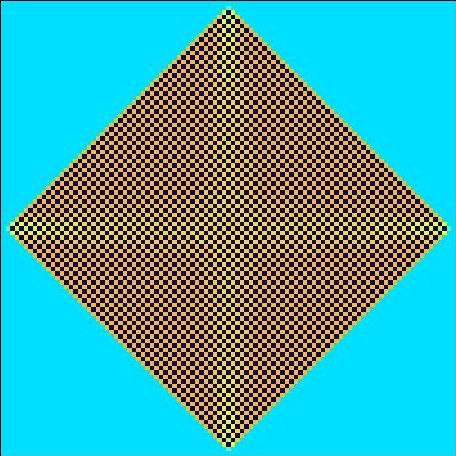
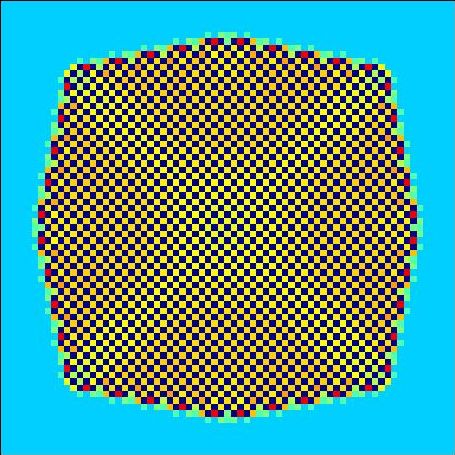
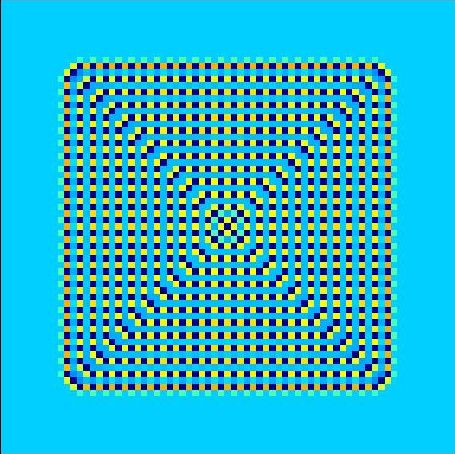
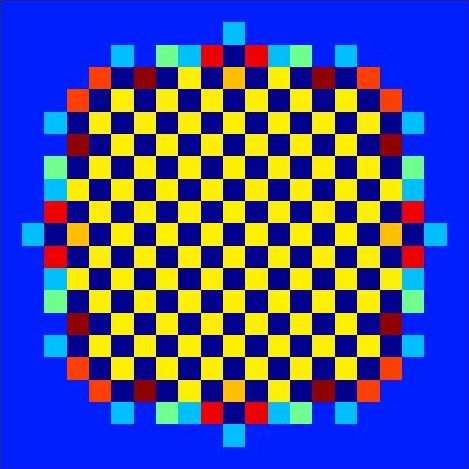
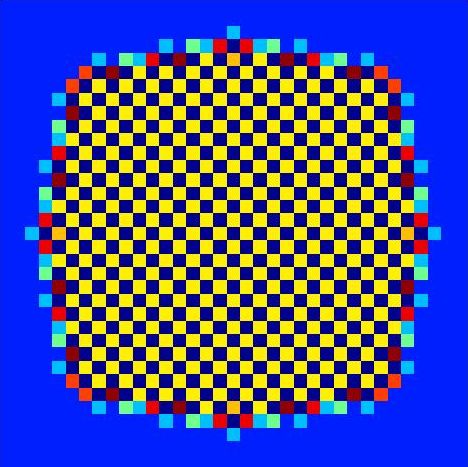
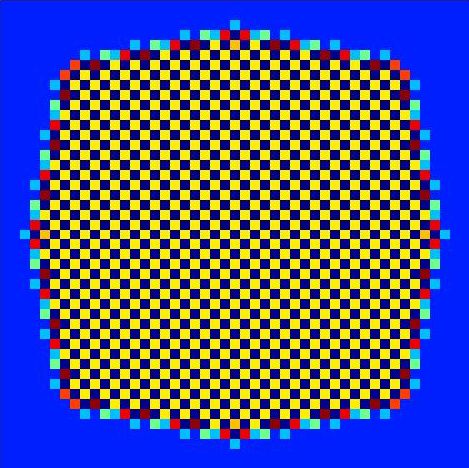
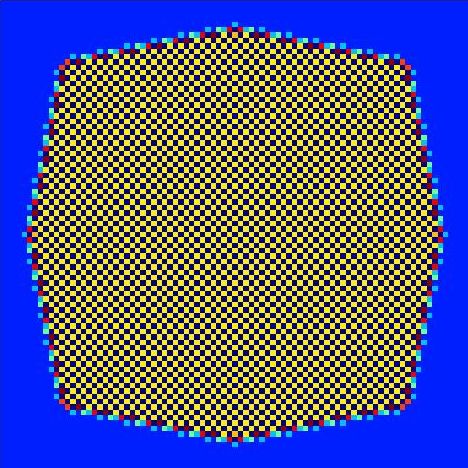
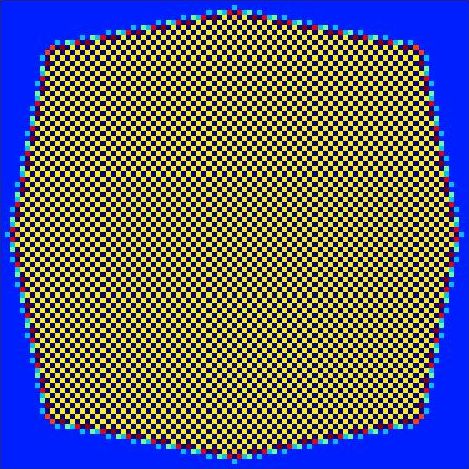
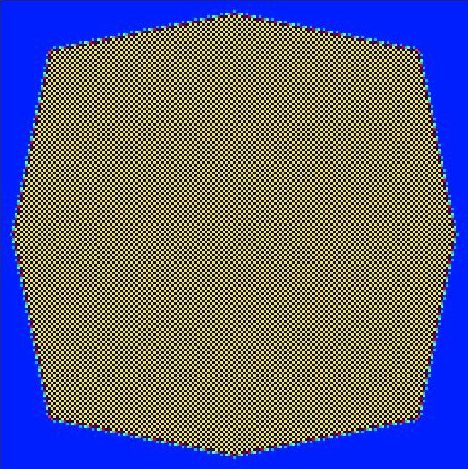
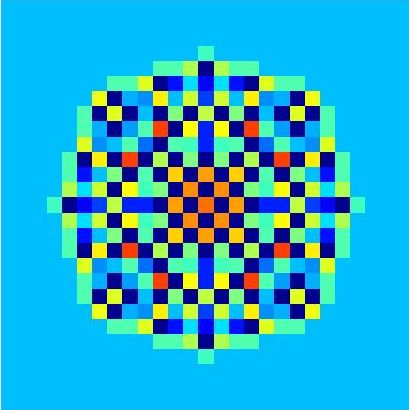
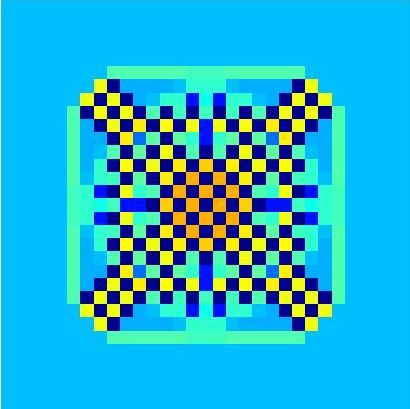
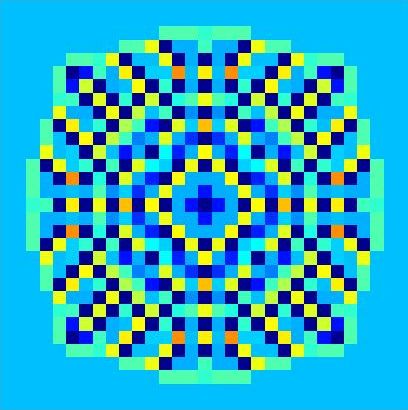
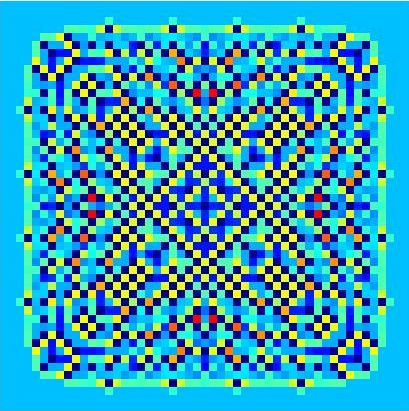
On this page you can find the color pictures from the paper "Limiting shapes for a nonabelian sandpile growth model and related cellular automata" By Anne Fey and Haiyan Liu.

Color scheme

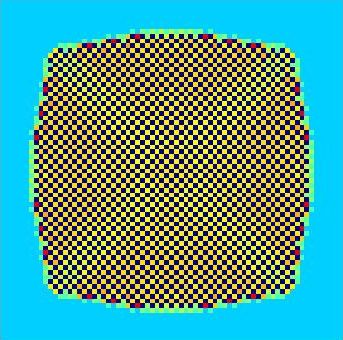
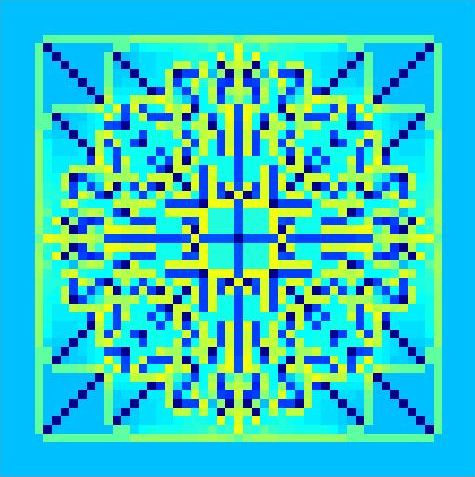
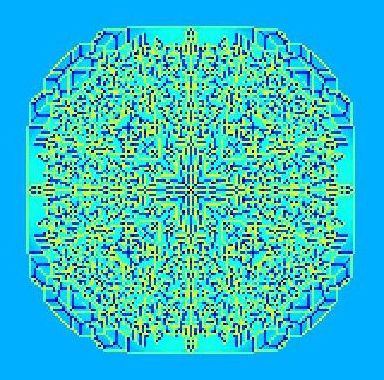
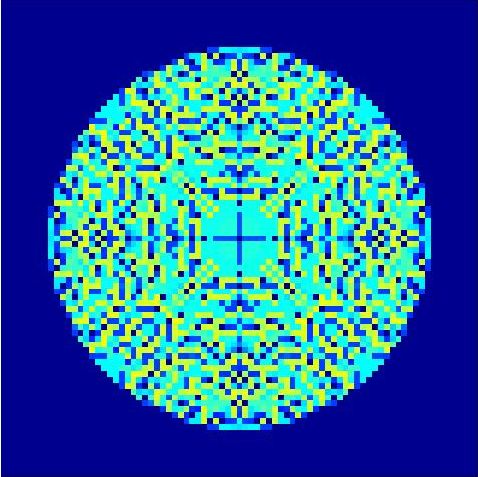
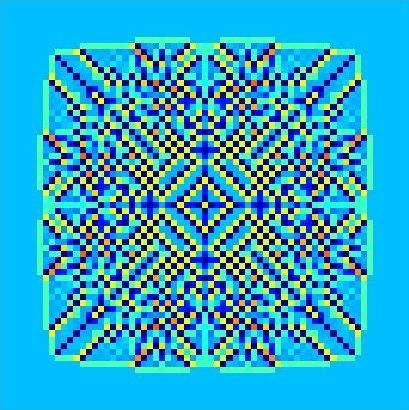
The mass at a cell is represented by colors from this colorbar ("Warmer" colors represent larger mass, yellow = mass 1):

flame colorbar


fig1_top_left fig1_top_middle fig1_top_right
Figure 1, top row. Left: h = 47/64 (approx. 0.734), middle: h = 1495/2048 (approx. 0.73), and right: h = 727/1024 (approx 0.71), each with n = 8 and after 50 time steps. Dark yellow, orange or red cells have mass at least 1.


fig1_bottom_left fig1_bottom_middle fig1_bottom_right
Figure 1, bottom row. Left: h = 1/2 and n = 256, middle: h = 511/1024 (approx. 0.499) and n = 2048, and right: h = 0 and n = 2048, each after the model stabilized. Light yellow cells have mass almost 1, dark blue cells have mass close to 0.


fig3_left fig3_middle fig3_right
Figure 3. Left: h= 3/4 = 0.75, middle: h= 23/32 (approx. 0.72), and right: h = 359/512 (approx. 0.701), each with n = 3 and after 50 time steps. Dark yellow, orange or red cells have mass at least 1. Below: see how these shapes grow!


fig3_left fig3_middle fig3_right


fig7_top_left fig7_top_middle fig7_top_right
fig7_bottom_left fig7_bottom_middle fig7_bottom_right
Figure 7. The octagon cellular automaton after 5, 15, 25, 55, 65 and 135 time steps. Black = e, yellow = c, dark yellow = c', light blue = p, dark blue = h, light green = m, orange = d', red = d!, dark red = q'.


fig9a fig9b fig9c fig9d fig9e
Figure 9. The splitting automaton with h=0.667 and n = 16, after 17, 24, 39, 76 and 103 time steps (animation below). In this case, a limiting shape may not exist.


sandpile growth model